In this age of Big Data, it is very rare to find a website that does not use some kind of web analytics program, and the majority of sites that use web analytics use Google Analytics (GA). Despite the widespread usage of GA however, many of the users that have access to GA accounts do not have much familiarity with the data available and what those data mean. In particular, I have found that many hoteliers who work with agencies often have access to their hotels’ GA accounts but do not regularly look at the data contained within, either because they are intimidated by the quantity of data or because they are content to let their agencies pull reports for them. At Blue Magnet, we believe not only that knowledge is power but also it is important to continually learn from our clients and educate them in turn. Therefore, we always encourage our hotel partners to regularly check their GA accounts, and we try to continually increase their knowledge and understanding of what the data mean. Since not every hotel is lucky enough to work with Blue Magnet though, we have put together “A Hotelier’s Guide to Google Analytics” to help hoteliers everywhere understand how to interpret and translate the data!
Basics
Before digging into the data, it is important to understand a few basic concepts. Without a base in the key concepts of web analytics & GA, it is very easy to misread or misinterpret GA reports, which can have dire consequences, and we certainly don’t want that. But we understand if you are pressed for time, so click here to go straight to the Useful Reports section (just come back and read this part later)!
- No tracking data is 100% accurate – This is a general tenet to keep in mind no matter what data/reporting you are looking at. There are flaws in all tracking methods and as Heisenberg (no, not Walter White) theorized, the very act of measuring an event changes the outcome of the event, making it impossible to perfectly capture reality in data. As a result, the data in a GA report will likely not exactly match data from other sources (e.g. AdWords, brand reporting, etc.).
- Google Analytics does not automatically track revenue and cannot track it for certain sites – One of the most interesting features of GA is Ecommerce tracking, which allows site owners to see where their revenue came from (i.e. Organic Search, Paid Media, Social Media, etc.) and how users behaved before they completed a purchase (e.g. they looked at an average of 10 pages before purchasing). Unfortunately, Ecommerce tracking is not available for branded hotels because the brands do not allow hotels to place tracking code on the brand reservation pages. For independent hotels however, Ecommerce tracking can be enabled as long as the hotels’ booking engines support the integration; however, setting up Ecommerce functionality can be tricky so it is not enabled for many boutique hotels. If you have an independent hotel, make sure your Booking Engine supports GA Ecommerce integration and find someone with GA experience to help you get it set-up.
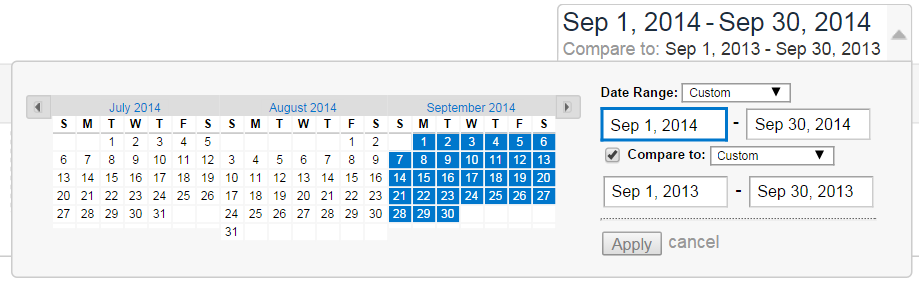
- Set the date range before you look at any data in GA – Data without context is meaningless, so set the date range to help make sense of your data. We recommend using Year over Year data if available because Month over Month data can be misleading due to seasonality.
- Google Analytics has two main data forms – Metrics & Dimensions
- Dimensions are categories of data. They are qualitative and usually written in letters. For example the dimension Source would have values such as “google” or “bing.” Important dimensions include:
- Source – The specific site or channel that a user arrived from (e.g. google, bing, tacos.com, (direct))
- Medium – The kind of site or channel that a user arrived from (e.g. organic, cpc, referral, (none))
- Landing Page – The page on which a user began her session (regardless of the source or medium)
- Page – The page where something (e.g. pageview, goal completion, event) happened
- Metrics are data that provide quantitative measures of user behavior. They are usually written in numbers. For example, the metric Sessions would have values such as 1,098 or 3,489. Important metrics include:
- Sessions – Number of sessions
- Bounce Rate – Percentage of single page sessions
- Pages/Session – Average number of pages viewed by users per session
- Avg. Session Duration – Average length of sessions
- Pageviews – Number of times a page was viewed (includes repeats)
- Dimensions are categories of data. They are qualitative and usually written in letters. For example the dimension Source would have values such as “google” or “bing.” Important dimensions include:
Useful Reports for Hoteliers
One of the issues that many hoteliers have with GA is that there is simply so many data and reports that it can be hard to determine where to go for useful and meaningful information. With that in mind, I am going to introduce you to 5 key reports that should give you a good idea of how your website is performing AND I will provide a template for a GA Dashboard that you can use to quickly check your site performance. All for the low, low cost of NOTHING!
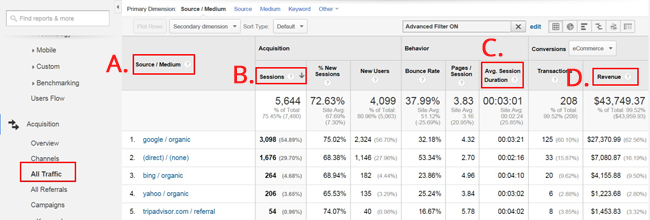
- All Traffic Report (Acquisition > All Traffic)
This is my favorite report for quickly checking the overall performance of a site. It provides a nice overview of your site performance, including:
- Source/Medium – Where your traffic came from
- Sessions – How many times users visited your site
- Avg. Session Duration – How long they stayed on your site
- Revenue or Goal Completions – How much revenue or how many goal completions each source brought in
The All Traffic Report is a great one to look at with YOY data because it will tell you exactly which traffic sources saw increases or decreases in performance. One thing to remember about this report is that it provides session level data, which is data that reflects all of a user’s behavior over multiple pages and during a certain time period (usually 30 minutes), as opposed to page level data which reflects user behavior on individual pages.
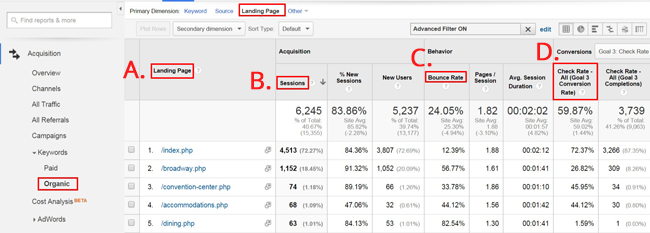
- Organic Landing Page Report (Acquisition > Keywords > Organic (Change Primary Dimension to Landing Page))
The Organic Landing Page Report will allow you to quickly judge the status and progress of your SEO efforts. Over the past few years, changes in Google’s algorithm have moved SEO reporting away from individual keyword phrases and toward general topics, so one great way to measure a website’s visibility for certain topics is to look at organic search visits to pages that revolve around that topic. This report will show you:
- Top Landing Pages – Pages on which a user’s session began, which will tell you what general topics users searched for when they found your site in search engines
- Sessions – Number of sessions that began on each landing page
- Bounce Rate – Percentage of users who left your site without visiting a second page, which can help you identify content that is driving traffic but not engaging users
- Conversion Rate – Landing pages that drove the most goal completions or revenue, which can help you apply the tactics of the successful pages to help improve the lower performing pages
Finally, keep in mind that although the “Primary Dimension” of this report is “Landing Page,” this report contains session level data; it shows the page on which the session began and all of the metrics reflect user behavior throughout the entire session, not just on the landing page.
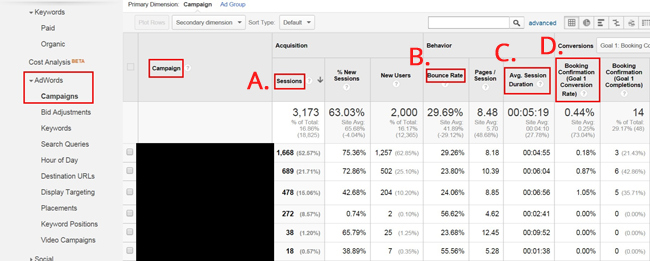
- Adwords Campaign Report (Acquisition > Adwords > Campaigns)
This report shows you how your paid AdWords traffic behaved after clicking on one of your ads, as opposed to the reporting in AdWords which contains information about your ads leading up to and including the click but not after the click.
The metrics in this report are the same session level metrics that were included in the above two reports (A. Sessions, B. Bounce Rate, C. Avg. Session Duration, D. Conversion Rate), and like those reports, this report allows you to see the volume, quality, and conversions for your Primary Dimension, in this case AdWords Campaigns.
Please note that like the Ecommerce tracking, this reporting is not automatically enabled and needs to be set-up before it will start pulling in AdWords information, but it is much easier to set-up than Ecommerce tracking. It will also allow you to pull Analytics data into AdWords which can be very helpful. Google has a simple guide to linking Analytics and AdWords located here.
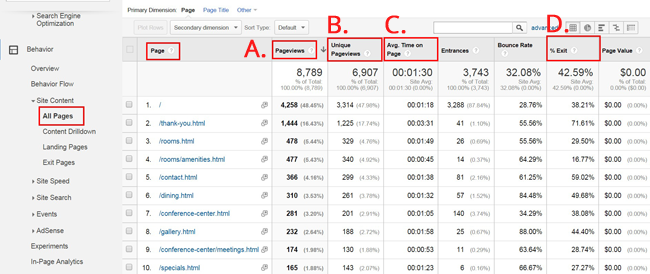
- All Pages Report (Behavior > Site Content > All Pages)
This provides an overview of site performance from a page level perspective, as opposed to the session level perspective of the previous reports. This report displays metrics reflecting user behavior on individual pages. It shows:
- Pageviews – Total number of times users looked at a page
- Unique Pageviews – Number of times a page was viewed at least once in a session
- Avg. Time on Page – How long they stayed on that specific page
- % Exit – Percentage of users who left the site after viewing a particular page
These metrics can help you identify the most popular pages on your site, see the value in pages that do not have much visibility in search engines but are highly viewed by users, and discover which pages users are spending the most time on and which ones might be driving them off the site.
To understand the difference between Pageviews and Unique Pageviews, think about if someone viewed the same page three times during a session. Maybe, she first went to rooms, then clicked to visit the Suites page, realized that she wanted to book a standard room and returned to the Rooms page, then decided to check the Specials page before booking, and finally returned to the Rooms page and clicked a Book Now link. That would be reported as 3 Pageviews and 1 unique Pageviews for the Rooms page.
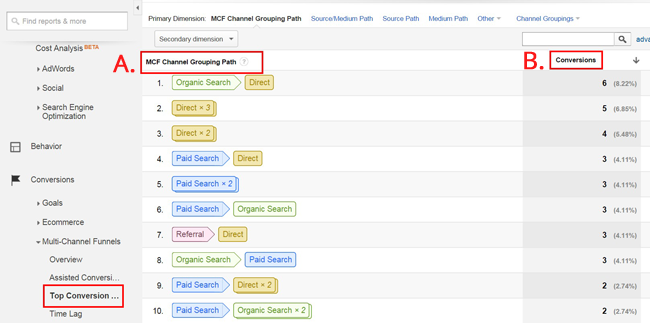
- Top Conversion Paths Report (Conversions > Multi-Channel Funnels >Top Conversion Paths)
This report is not an essential report like the above reports, but it is a great example of the interesting and lesser known reports available from GA. The report shows:
- Multi-Channel Grouping Path – The mix of different traffic sources that contributed to conversions on your site. For instance, it will not only show the number of times users found your site through Google (Organic Search) and booked, but it will also show you how many times users found your site through Google, bookmarked your site, and then visited your site from that bookmark two separate times (Direct X 2) before booking.
- Conversions – The total number of goal completions that each conversion path contributed to your site. This differs from standard conversion data which just shows the final medium a user came from before converting regardless of if they had visited the site before from a different medium.
The Top Conversion Paths Report provides a different perspective on your traffic than the All Traffic Report and will get you thinking about multi-channel conversions and attribution models, which will become more and more important as the internet continues to become more fragmented and specialized.
Tip: Set the Path Length to “All” to see all of your conversion paths.
Dashboards and Beyond
The above five reports are just the tip of the Google Analytics iceberg, but if you check them regularly and understand what they can tell you about your site, you will not only be able to monitor the performance of your site but you will also be well equipped to explore all of the other reports and data available within GA.
Finally, as promised, I have created a Hotelier’s Quick Stats Dashboard Template that pulls the most important metrics from the above reports into one master report. All you have to do to use it is click on the following link, login to your GA account, and choose the View to which you want to add the Dashboard:https://www.google.com/analytics/web/template?uid=VRTzTQ0QRbWAeFzQ9N4S-A.
Depending on how your GA account is set-up, it might take some minor tweaking to get the Dashboard to pull in the correct metrics, so if you have any questions, contact us today or ask us on Twitter: @Blue_Magnet.