Creating engaging content on Twitter (and getting your message across is 140 characters or less) is only one piece of the puzzle. Monitoring and measuring the performance of your Tweets is the ultimate key to success. As you optimize your hotel’s Twitter strategy, harness the power of Twitter Analytics to better understand how your followers are engaging with your Tweets and where there is room for improvement. This way, your social media team can make the necessary changes to increase engagement, grow your following, and drive traffic to your hotel’s website.
How to Get Started Using Twitter Analytics
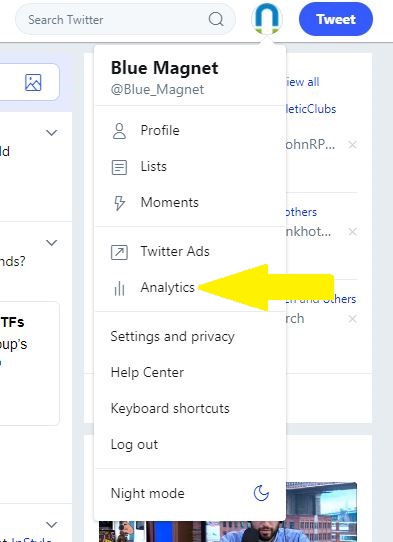
Click your profile photo in the upper right hand corner. Then, in the drop down menu, select Analytics.
To get the most benefit out of Twitter Analytics, focus on these three main sections: the home page, the Tweet activity dashboard, and the audience insights dashboard.
Account Home
Once you have entered Twitter Analytics, a 28 day summary (compared to the previous twenty-eight day period) will display at the top of the page. Twitter refers to the home page as your “Twitter report card,” and it provides a high-level overview of metrics such as your tweet volume (how many tweets you published), how many impressions you received, and how many followers you have.
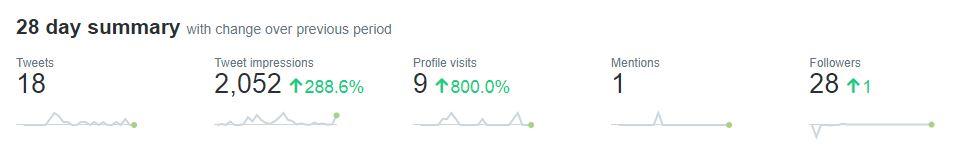
Below your account’s 28 day-summary, you will find monthly reports that provide an excellent snapshot of your performance to-date for the current month or for previous months in their entirety. Important statistics here include:
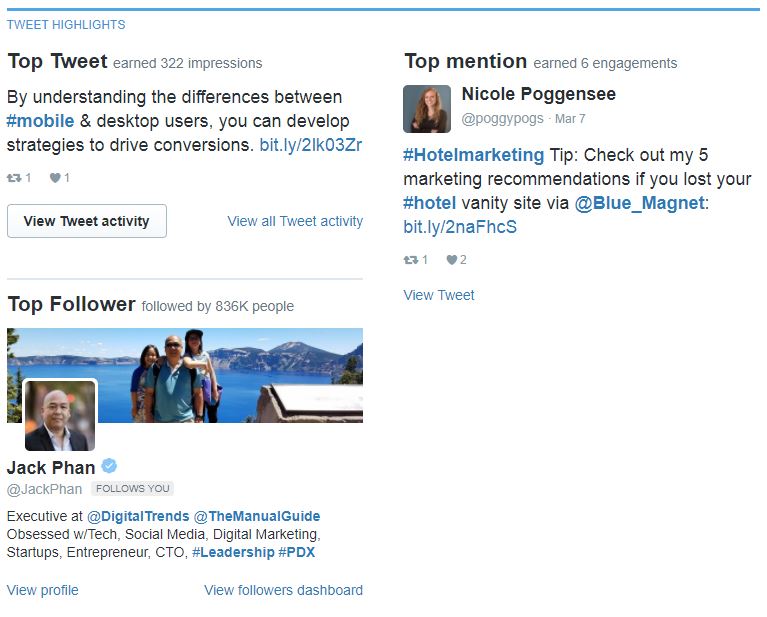
- Top Tweet and Top Media Tweet: This shows you which tweets performed the best during that month. The “Top Tweet” is the highest performing tweet overall; the “Top Media Tweet” is the highest performing tweet that included media (i.e. a photo or video).
- Top Mention: This is the tweet, published by another user, in which your hotel was mentioned that received the most impressions.
- Top Follower: This is the user that follows your account who has the largest number of followers.
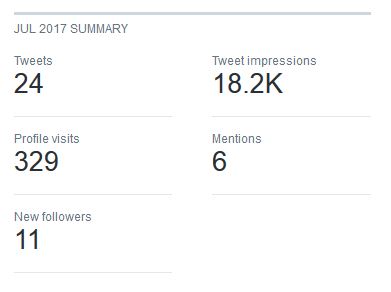
In the right hand column, you will notice there is a monthly summary (see screenshot below for an example of what this looks like). Use this report to monitor tweet volume to date for that month, how many visits there were to your profile, total tweet impressions for that time period, number of mentions, and number of new followers.
Why This is Helpful: The information shown in the summary can help your hotel’s social media team set and track goals. If you are running a tweet promotion campaign, checking out your “Top Tweet” and “Top Media Tweet” will help you determine which content to promote and what type of content you should tweet more of to replicate this success. Knowing who your top follower is can help pave the way to more impressions as well. Check out what they are tweeting about and routinely engage with them. Take advantage of their following and start conversations to get your brand in front of their followers in addition to your own!
Tweets
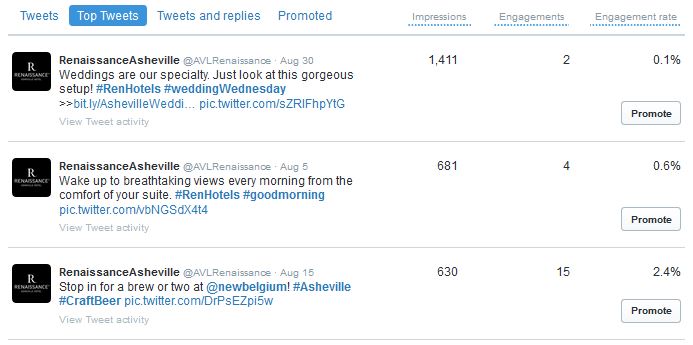
On your Tweet Activity Dashboard, discover how every single tweet (organic or tweets associated with campaigns) performed. Underneath the rolling 28-day impressions summary, you will find four categories to choose from: Tweets (all tweets), Top Tweets (best performers), Tweets and replies (your replies to other @usernames), and Promoted (tweets that were only published as part of a campaign). For each tweet, you can see the number of impressions and engagements that were received as well as the engagement rate. But what does this mean?
Impressions: The number of time users saw your Tweet. *Users means any user, not just your followers.
Engagements: An engagement is any interaction a tweet receives. An engagement can come in the form of a retweet, a reply, or someone clicking anywhere on the Tweet (including a link, hashtag, username, etc.).
Engagement Rate: Impressions divided by engagement. This tells you what percentage of impressions earned an engagement.
The time frame for this data is automatically selected to represent the last 28 days; however, you can change this to showcase the last seven days, any given month, or a three month period.
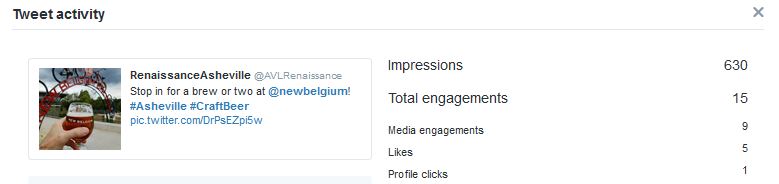
From here, click on any individual tweet for even more information.
Why This is Helpful: This dashboard allows you to educate yourself on what type of content appeals most to your audience. Take a look at this tab while you are planning your hotel’s content calendar for insight on what your followers (and other users) want to see more of. By selecting the Top Tweets tab, you can easily see the best performers and strategize accordingly.
Audience
Learn more about your followers under the Audience section. Discover their demographics (i.e. age, gender, location, marital status), interests, occupation, and more. Certain accounts have access to even more data, such as consumer behavior and lifestyle types. You can even compare your followers to all Twitter users or custom comparison audiences. To do so, select “Add a comparison audience” and build your follower persona from there.
Why This is Helpful: While your reach extends far beyond your followers, it is crucial to take the time to learn who your audience is. This will not only help you to improve Tweet performance, but can provide guidance for target audiences for future ad campaigns as well. Use the information shared here to grow your account by followers who are going to enjoy and engage with your Tweets and to fine-tune your ongoing strategy to appeal to your current audience.
Key Takeaways
Use the information in Twitter Analytics to analyze your performance, get to know your audience, and make strategic decisions to improve your future content. Don’t forget…
- Stop by the Account home page frequently (the data is updated daily). Are you on track to outperform yourself the previous month? If not, why? Who is your current top follower? How can you engage with them?
- Look over Twitter Analytics before setting up paid campaigns. Use the information found in the Tweets section to help craft your ad creatives.
- What type of engagement are your Tweets receiving? Are users clicking on links that are intended to drive traffic to your hotel website? If so, great! If not, how can you rework your Tweet copy to entice users to click to learn more?
- Use the Audience page to discover how to tailor your delivery of hotel initiatives and offers. Use interests and demographic data to keep Tweets relevant.
Want more? Sign up for the Blue Magnet newsletter and be on the lookout for our upcoming Analytics Guide for Pinterest. In the meantime, learn how to monitor your performance on Facebook.